UCI Machine Learning RepositoryよりPoker Hand

UCI Machine Learning Repository: Poker Hand Data Set

ポーカーの手の判定。プログラミングの課題でよくあるけど、統計的な分類で判定します。

> head(df)
  C 1 C 2 C 3 C 4 C 5 C 6 C 7 C 8 C 9 C 10 C 11
1   3  12   3  11   3  13   3  10   3    1    9
2   4  10   4  11   4   1   4  13   4   12    9
3   4   1   4  13   4  12   4  11   4   10    9
4   1   2   1   4   1   5   1   3   1    6    8
5   1   9   1  12   1  10   1  11   1   13    8
6   2   1   2   2   2   3   2   4   2    5    8

0: Nothing in hand; not a recognized poker hand 
1: One pair; one pair of equal ranks within five cards 
2: Two pairs; two pairs of equal ranks within five cards 
3: Three of a kind; three equal ranks within five cards 
4: Straight; five cards, sequentially ranked with no gaps 
5: Flush; five cards with the same suit 
6: Full house; pair + different rank three of a kind 
7: Four of a kind; four equal ranks within five cards 
8: Straight flush; straight + flush 
9: Royal flush; {Ace, King, Queen, Jack, Ten} + flush 


役の分布 N=25008 
0     1     2     3     4     5     6     7     8     9 
12493 10599  1206   513    93    54    36     6     5     3 

ロイヤルフラッシュは0.0001199616 !1/一万

元の特徴量はカードのスートと数で、1-9の役を目的変数として(C11,当然質的変数に直して)、そのままやっても上手くいくハズはないので、 1.カードの重複枚数の1番大きい数 2.カードの重複枚数の2番目に大きい数 3.スートが5つ揃っていらTrueそうでなければFalse 4.ストレートの判定 5.ストレートフラッシュの判定

と特徴量を直して、randomForestで分類。

こんなに追加したら普通に判定するのと大して変わらないような気もするのですが、該当部分は23行で書けているのでいいのかなと。モノ的にエラー率0%じゃないとダメでしょうし。 forの中でソートを2回しているのはスルーしてくださいw

df=read.csv("https://archive.ics.uci.edu/ml/machine-learning-databases/poker/poker-hand-training-true.data")
colnames(df)=paste("C",as.character(1:11))


#特徴量の追加
ncard1=c()
ncard2=c()
suit=c()
straight=c()
sf=c()
for(i in 1:N){
  dsuit=df[i,c(1,3,5,7,9)]
  d=df[i,c(2,4,6,8,10)]
  hoge=sort(table(as.numeric(d)),decreasing = T)
  d1=hoge[1]
  d2=hoge[2]
  ncard1=c(ncard1,d1)
  ncard2=c(ncard2,d2)
  #スート
  if(length(unique(as.numeric(dsuit)))==1){
    same_suit=1
  }else{
    same_suit=0
  }
  suit=c(suit,same_suit)
  
  d=sort(d)
  if(d[5]-d[1]==4 || setequal(d,c(1,10,11,12,13))){
    st=T
  }else{
    st=F
  }
  straight=c(straight,st)
  hoge=ifelse(max(d)==13 && min(d)==1 && st,T,F)
  sf=c(sf,hoge)
}

df2=cbind(ncard1,ncard2,suit,straight,sf)
df2=data.frame(df2)
df2$straight=factor(df2$straight)
df2$sf=factor(df2$sf)

df2=cbind(df2,y=df[,11])

df2$y=factor(df2$y)
df2$suit=factor(df2$suit)
rownames(df2)=as.character(1:N)


N=nrow(df2)
trn=sample(N,floor(N)*0.7)
train=df2[trn,]
test=df2[-trn,]


library(randomForest)
tuneRF(y = train[,6],x=train[,-6],type="classification")

rf=randomForest(y~.,data=train,mtry=5,type="classification")

pred=predict(rf,newdata=test)
cm=table(test$y,pred)
print(cm)

   pred
       0    1    2    3    4    5    6    7    8    9
  0 3824    0    0    0    0    0    0    0    0    0
  1    0 3121    0    0    0    0    0    0    0    0
  2    0    0  352    0    0    0    0    0    0    0
  3    0    0    0  156    0    0    0    0    0    0
  4    0    0    0    0   18    0    0    0    0    0
  5    0    0    0    0    0   17    0    0    0    0
  6    0    0    0    0    0    0    8    0    0    0
  7    0    0    0    0    0    0    0    4    0    0
  8    0    0    0    0    0    0    0    0    2    0
  9    0    0    0    0    0    0    0    0    0    1
グリッドの人の移動と軌跡のクラスタリング

Pythonjavascript

f:id:biones:20150922194909p:plain

http://biones.dip.jp/space/space.py (鯖が止まってると動かない可能性あり)

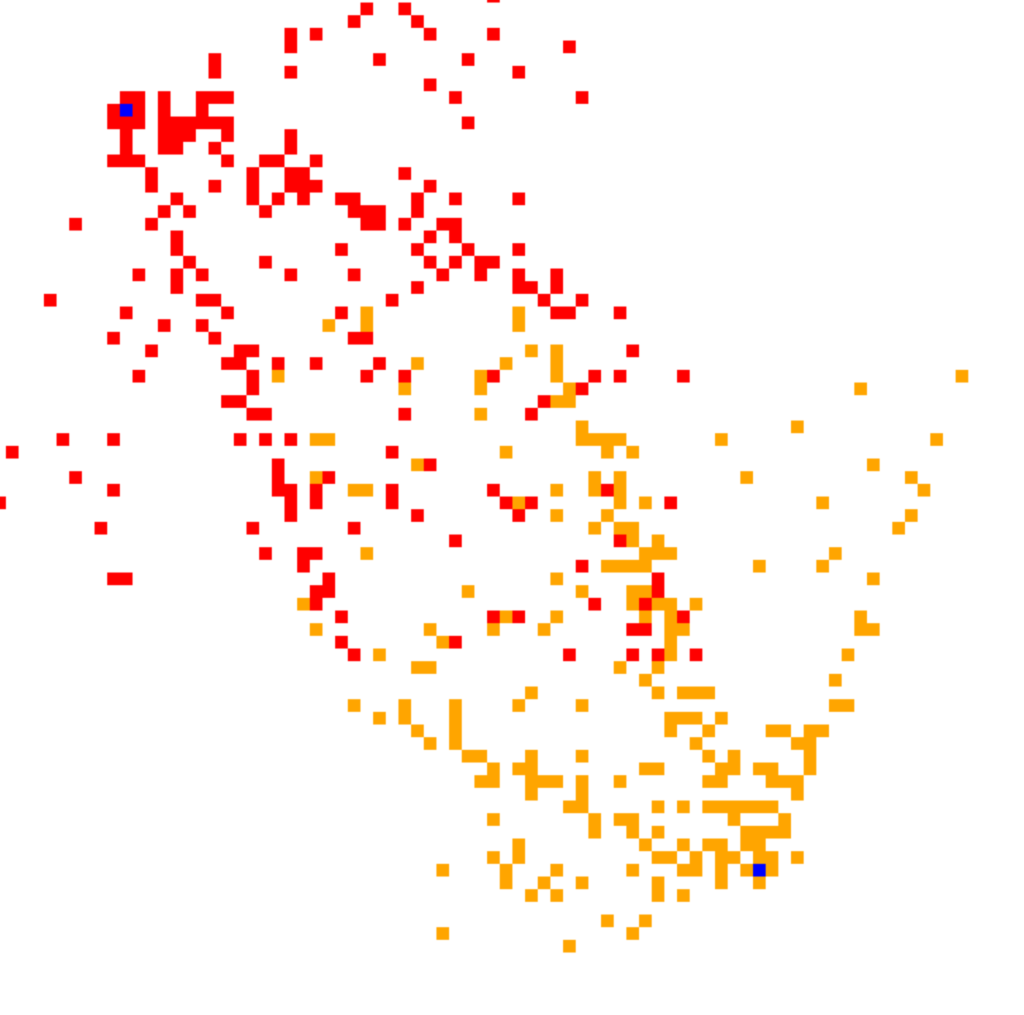
的なモノを昔作って何か分析しようとおもいつつ放置していたのに再着手。 青色の点が目的地。

歩行軌跡間の「近さ」はデータの長さが違っても類似度が計算できるDynamic Time Warping距離

ダイナミックタイムワーピング距離に基づくストリーム処理 http://www.ieice.org/iss/de/DEWS/DEWS2007/pdf/l6-5.pdf

で測って、距離行列を作成、k-medroid(pamパッケージ)でクラスタリングして、何処に向かっているか判定します。

生成の方のコードは長くかつ汚いので省略(このRコードもきたな・・・)。

m=read.csv("~/Desktop/traject.csv")
m=m[,-1]

library(dtw)

hns=sort(m$human_no)
hns=unique(hns)

library(ggplot2)
gdf=data.frame(matrix(ncol = 4)) #ggplot用
colnames(gdf)=c("hn","x","y","cl")
#gdf=gdf[-1,]

#プロット用
plt=function(gdf){
  gdf$cl=factor(gdf$cl)
  for(hn in hns){
    x=subset(m,human_no==hn)$x
    y=subset(m,human_no==hn)$y
    
    hoge=pm$clustering
    cl=hoge[names(hoge)==as.integer(hn)]
    if(length(cl)<=0){
      next
    }
    tdf=cbind(hn,x,y,cl)
    gdf=rbind(gdf,tdf)
  }
  gp=ggplot(data=gdf,aes(x=x,y=y,color=cl))+geom_point()
  
  print(gp)
}


#距離行列の計算

hoge=combn(hns,2)
dmat=data.frame(NULL)
cc=combn(hns,2)
for(j in 1:dim(hoge)[2]){
  c=cc[,j]
  x1=subset(m,human_no==c[1])$x
  y1=subset(m,human_no==c[1])$y
  
  x2=subset(m,human_no==c[2])$x
  y2=subset(m,human_no==c[2])$y
  
  dist=dtw(x=cbind(x1,y1),y=cbind(x2,y2))  #DTW距離
  
  dmat[paste(c[1]),paste(c[2])]<-dist$distance
  if(j%%1000==0){
    print(j) 
  }
}

for(i in 1:dim(dmat)[1]){
  for(j in 1:dim(dmat)[2]){
    if(is.na(dmat[i,j])){
      dmat[i,j]<-0
    }
  }
}

#クラスタリング
pm=pam(dmat,k=5)#クラスタ数は既知
pred=pm$clustering

mokutekiti=floor(as.numeric(names(pred))/1000)+1 #human_noの4桁目で目的地を分けているので
res=table(mokutekiti,pred)
print(res)

plt(gdf)

目的地の生成部分

f.generate("S1",10,10)
f.generate("S2",70,60)
f.generate("S3",10,40)
f.generate("S4",10,20)
f.generate("S5",80,70) 

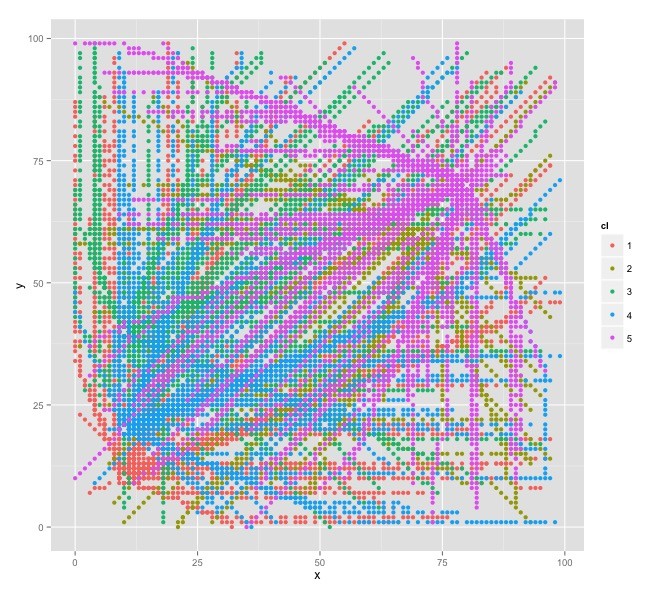
結果。

          pred
mokutekiti   1   2   3   4   5
         1 100   0   0   0   0
         2   0 100   0   0   0
         3   0   3  94   3   0
         4   0   0  17  83   0
         5   0   0   0   4  95
  

f:id:biones:20150922202413j:plain

ggplot頑張ったけど見づらいですorz

距離行列の計算が重くて500人程度でも時間がかかるので、隠れマルコフモデルで再チャレンジしてみようかと・・・。

CodeIQ 「スロット・マシン」 問題

Kawazoe (@riverplus) n 個のリール(数字が描かれている部分です)を持つスロットマシンを回します。 各リールには、0 から 9 のいずれかの数字がランダムに出ます。 このとき、「最も多く出現した数字の出現回数」に等しいドルが賞⾦として得られます。

例えば n = 6 のスロットマシンを考えましょう。 各リールに、左から順に 7 7 5 1 0 7 という数字が出たとします。 このとき、7 の数字が最も多く 3 回出現していますので、賞⾦は 3 ドルです。

リールの数字が 0 2 0 9 2 6 のとき、賞⾦は 2 ドルです。 リールの数字が 1 2 3 4 5 6 のとき、賞⾦は 1 ドルです。 リールの数字が 8 8 8 8 8 8 のとき、賞⾦は 6 ドルです。

このスロットマシンを 1 回まわしたときの賞⾦の期待値を F(n) とします。 例えば F(1) = 1,F(2) = 1.1,F(3) = 1.29 となることが確かめられます。

■ 第1問 (Normal) F(6) の値を求めて下さい(四捨五⼊は不要です)。

■ 第2問 (Hard) F(12) の値を求めて下さい(四捨五⼊は不要です)。

import numpy as np
from scipy import misc

def bunkatu(n,x):
    if n<=0:
        return [[]]
    if x==1:
        return  [[1]*n]

    s1=[]
    if n>=x:
        s1=bunkatu(n-x,x)
        for i in range(len(s1)):
            s1[i].insert(0,x)

    s2=(bunkatu(n,x-1))
    s1.extend(s2)

    return(s1)

def haiti(bunkatu):
    n=sum(bunkatu)
    bn=[]
    bunkatu.append(-1)
    cnt=0
    for i in range(len(bunkatu)-1):
        cnt+=1
        if bunkatu[i]!=bunkatu[i+1] or bunkatu[i+1]==(-1):
            bn.append(cnt)
            cnt=0
    bunkatu.pop()
    hoge=1
    for b in bunkatu:
        hoge=hoge*misc.comb(n,b)
        n=n-b
    for b in bn:
        hoge=hoge/misc.factorial(b)

    return(hoge)

'''
最大k個揃う確率をP(k)とすると
P(k)=g(n,k)/10^n
g(n,k):最大でk個揃うパターンの総数
n:スロットの数
g(n,k)はたとえば n=8,k=3とすると[3,3,2],[3,2,2,1]等,8を最大3になるような自然数で分割し、
各々の分割に対して
(それらを配置するパターンの数A)×(数の割り振りパターンB)
Aは例えば[3,3,2]だったら 8C3*5C3*2÷2!通り  (3組、3組がダブルカウントだから2!で割る)

Bはたとえば3種類だったら10*9*8通り
A*Bを足し上げます。

nを最大x個の和で表す分割パターンの列挙は、bunkatu(n,x)で行います。
xを使う場合と使わない場合に分けて、再帰でリストを返しています。


'''

#期待値の計算
n=12
s=0
for k in range(1,n+1):
    hoge=bunkatu(n-k,k)
    for i in range(len(hoge)):
        hoge[i].insert(0,k)
    tmp=0
    for h in hoge:
        m=len(h)
        hh=np.arange(10,10-m,-1) #数の振り分けパターン
        hh=np.product(hh)
        tmp+=haiti(h)*hh
    s+= k*tmp/(10**n)


print(s)

Wine Quality

練習。

UCIのデータセットより。

UCI Machine Learning Repository: Wine Quality Data Set

hoge=sample(1:1599,900)
#900件をトレーニング用に
train=wine[hoge,]
test=wine[-hoge,]

# 0.66くらい相関がある特徴があったけど、とりあえずただの線形回帰
train.lm=lm(data=train,quality~.)
wine.pred=predict(train.lm,newdata = test)
mse(test$quality,wine.pred)
#√mseです
#0.6576445

#ランダムフォレスト
#mtryはTunerfより
train.rf=randomForest::randomForest(data=train,quality~.,mtry=3)
wine.pred.rf=predict(train.rf,newdata = test)

mse(test$quality,wine.pred.rf)
#0.6297493
#多少良くなった

f:id:biones:20150822141322j:plain

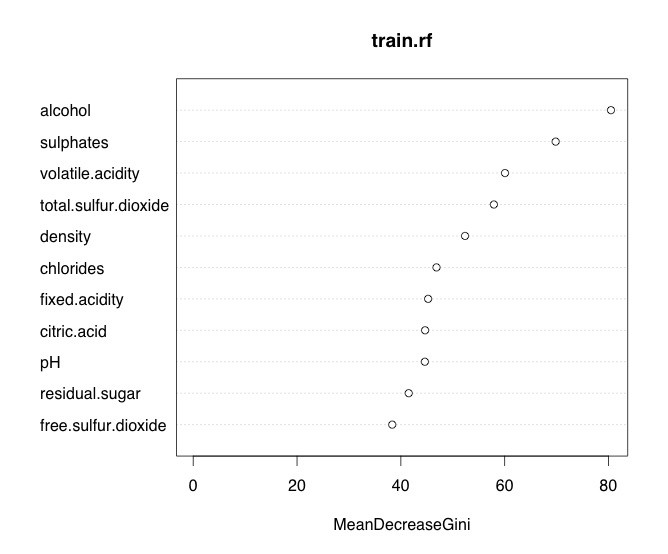
正則化、PCAでは特に削れる特徴量はなさそうでした。 quality=7,8の時の誤差が大きいのは気になるけど(-1.0くらい)、どーなんでしょう。

夏場は炭酸が多いけど、赤ワインは基本毎日飲んでます。800円付近のネロ・ダヴォラ、サンライズボルドーあたり。就職したらデイリーワインに1500円くらい使ってみたいですね(´;ω;`)ブワッ

t→x,yの擬似相関

下の例で計算すると0.96。

{ \displaystyle
x_t=2*x_t-1+x_t-2+e_{trend}
}
線形トレンド

y_t=x_t+e_{obs}
観測方程式 の状態空間で、x,y(変数名の方)の残差の相関をstanで計算すると-0.12程度になった。

N.t=60
mu.x = numeric(N.t)
x = numeric(N.t)
mu.y = numeric(N.t)
x=y=c()
mu.x[1] = mu.y[1] = 10
s1 = 2
s2 = 1
for (t in 1:(N.t - 1)) {
  x[t] = rnorm(1, mu.x[t], s1)
  mu.x[t + 1] = rnorm(1, mu.x[t] + 1, s2)
  y[t] = rnorm(1, mu.y[t], s1)
  mu.y[t + 1] = rnorm(1, mu.y[t] + 1, s2)
}
x[N.t] = rnorm(1, mu.x[N.t - 1], s1)
y[N.t] = rnorm(1, mu.y[N.t - 1], s1)

scodeaa="
data{
  int N;
  real x[N];
  real y[N];
}
parameters{
  real sigma_x;
  real sigma_y;
  real trend_x[N];
  real trend_y[N];
  real sigma_trend_x;
  real sigma_trend_y;
}

model{
  for(t in 3:N){
    trend_x[t]~normal(trend_x[t-1]*2-trend_x[t-2],sigma_trend_x);
    trend_y[t]~normal(trend_y[t-1]*2-trend_y[t-2],sigma_trend_y);
  }
  x~normal(trend_x,sigma_x);
  y~normal(trend_y,sigma_y);
}


"

library(rstan)
fit=stan(model_code = scodeaa,data = list(N=N.t,x=x,y=y),chain=1,iter=200)

la=extract(fit)
tr_x=apply(la$trend_x,2,mean)
tr_y=apply(la$trend_y,2,mean)
cor(x-tr_x,y-tr_y)
#>[1] -0.1202267